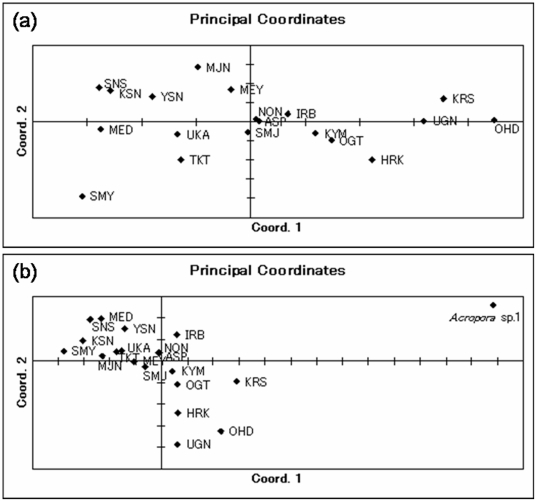
Figure 2. Plots of the principal coordinate analysis (PCA) from the covariance matrix with data standardization calculated using GenAlEx for Acropora digitifera.
(a): Plots of A. digitifera at 19 sites. F ST: the first two axes explain 58.43% of the variation (the first axis explains 38.99%, the second axis 19.44% of variation). The minimum scale is 0.01 values on the x and y-axis. (b): Plots of A. digitifera including the data of Acropora sp. 1. F ST: the first two axes explain 70.30% of the variation (the first axis explains 57.12%, the second axis 13.18% of variation). The minimum scale is 0.01 values on the x and y-axis.

