FIG. 5.
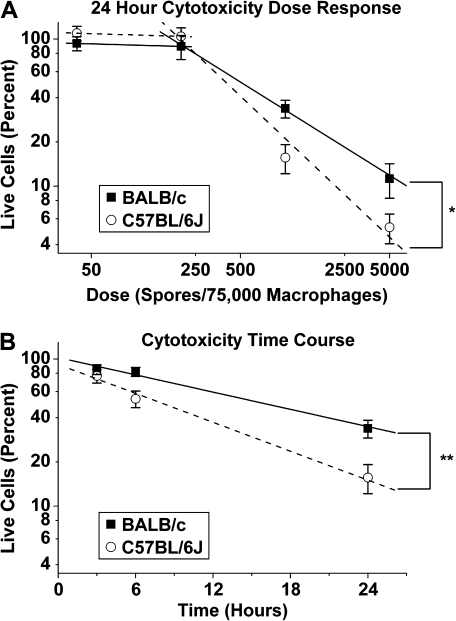
Spore cytotoxicity in vitro. Spores are significantly more cytotoxic to C57BL/6J AMs than to BALB/c AMs. A total of 75,000 cells were plated per well for all wells. Data are shown as mean ± SE. (A) Dose (spores per macrophage) verses live cells as a percent of baseline (baselines are calculated as the total number of live and dead cells in matched wells with no spores). Graph is on a log-log scale. Slopes from 0.0027 to 0.06667 spores per macrophage for C57BL/6J (0.97) are significantly different from BALB/c (0.68) (*p = 0.007, repeated measures analysis, broken stick model). (B) Time course of cytotoxicity at 0.0133 spores per macrophage dose. Time (hours) versus live cells as a percent of baseline (baselines are calculated as the total number of live and dead cells in matched wells with no spores). Percent is graphed on a log scale. Slope of C57BL/6J (0.098) is significantly different from BALB/c (0.086) (**p = 0.04, repeated measures analysis).

