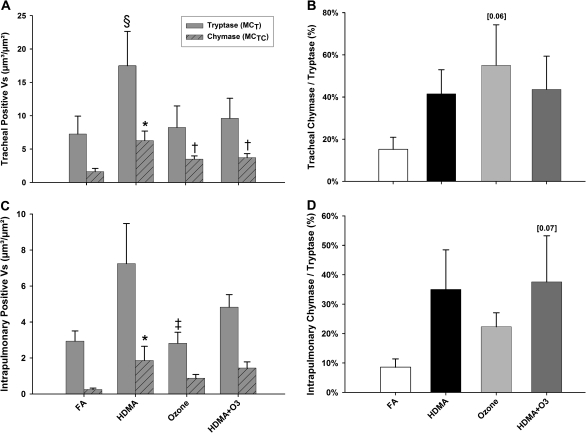
FIG. 5.
MCT and MCTC cell mass (Vs) in the trachea and intrapulmonary conducting airways. (A) HDMA allergen–exposed animals had both significantly greater MCT and MCTC cell mass compared to FA controls. Interestingly, HDMA MCTC cells are also significantly greater compared to all other aerosol exposures in the trachea. (B) Individual MCTC Vs plotted as a percentage of total mast cells in the trachea. A trend showing increased percentage of MCTC/MCT can be seen following all aerosol treatments compared to FA controls. A large increase in the MCTC/MCT ratio is seen between O3-treated (55%) compared to FA animals (15%). But due to a large variance within the data, the comparison was insignificant (p = 0.06). (C) Within the intrapulmonary component, MCTC Vs increased significantly following HDMA exposure compared with both FA controls and O3 aerosol treatments. Surprisingly, MCT Vs was not significantly increased following HDMA exposure, as compared to FA controls. (D) Comparable to the trachea, the percentage of intrapulmonary MCTC/MCT also trended in an increasing fashion following aerosol exposures compared to FA controls. The combined HDMA + O3–exposed group had the greatest MCTC/MCT ratio compared to FA controls (38 vs. 9%) but failed to reach significance (p = 0.07). Data are shown as means ± SEM (n = 5–6 monkeys per group). *p < 0.05, MCTC Vs as compared with FA controls in the same airway region. †p < 0.05, as compared with HDMA treatment in the trachea. §p < 0.05, MCT Vs as compare with FA treatment in the trachea. ‡p < 0.05, as compared with HDMA treatment in the intrapulmonary region.

