Fig. 6.

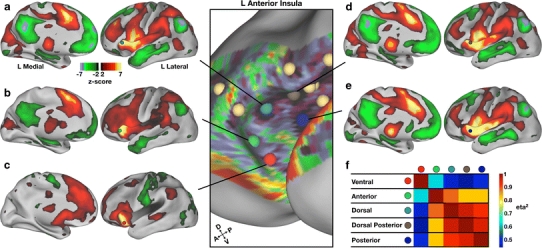
An examination of the rs-fcMRI correlation patterns of the five putative area locations in left anterior insula (aI) reveals some distinct and overlapping patterns of functional connections. a–e rs-fcMRI correlation maps depicting regions of significant positive (dark red to yellow, z-score > 2.00) and negative (dark green to blue, z-score < −2.00) correlations with each seed are shown on left lateral and medial inflated cortical surfaces (Caret). The location of each seed is shown on the left aI view (center of figure) and also on the lateral surface of the correlation map. f The similarity between the rs-fcMRI correlation maps is quantified using eta2 and displayed as a matrix that represents the relationship between each region in the aI. Eta2 values approaching 1 are indicative of highly similar maps, whereas eta2 values near 0.5 indicate that the two maps are statistically independent from one another
