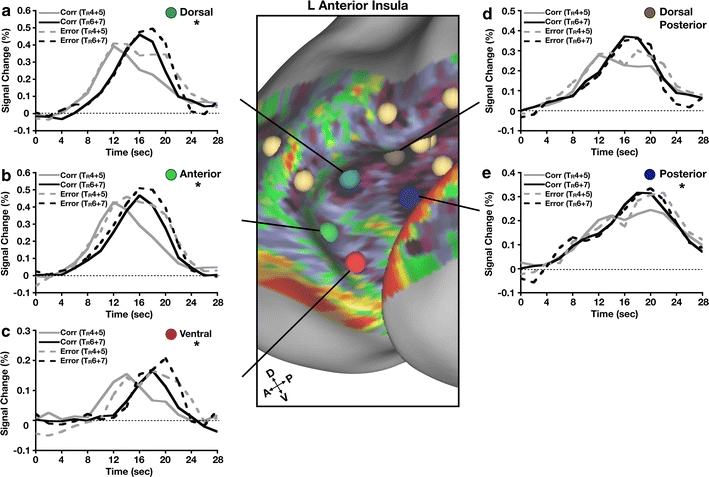
Fig. 8.

Error processing in anterior insula (aI). a–e For each region in aI, time courses were extracted for correct responses (early = TR4 + 5 and late = TR6 + 7) and errors (early = TR4 + 5 and late = TR6 + 7). Time courses are graphed in units of % signal change from baseline (dotted line) as a function of time in seconds. A correctness × time repeated measures ANOVA was calculated for each region to identify effects of error vs correct responses. *p < 0.001
