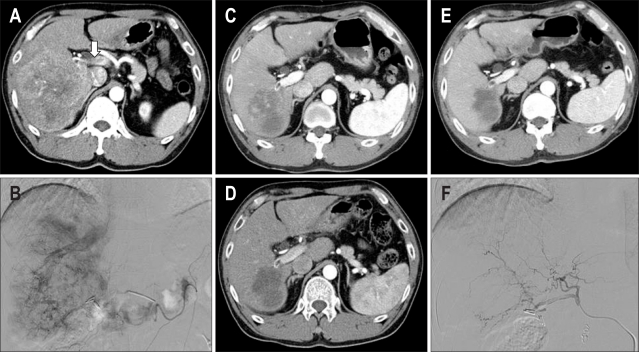
Fig. 1.
CT and hepatic arteriogram. (A, B) CT and angiogram showing a massive hepatocellular carcinoma in the right lobe of the liver and invasion of the main portal vein (arrow). (C, D) After the second and third cycles, the tumor mass is markedly decreased. (E, F) After the completion of six cycles, his serum α-fetoprotein level decreased to 2.8 ng/mL (from 5,845 ng/mL before treatment).

