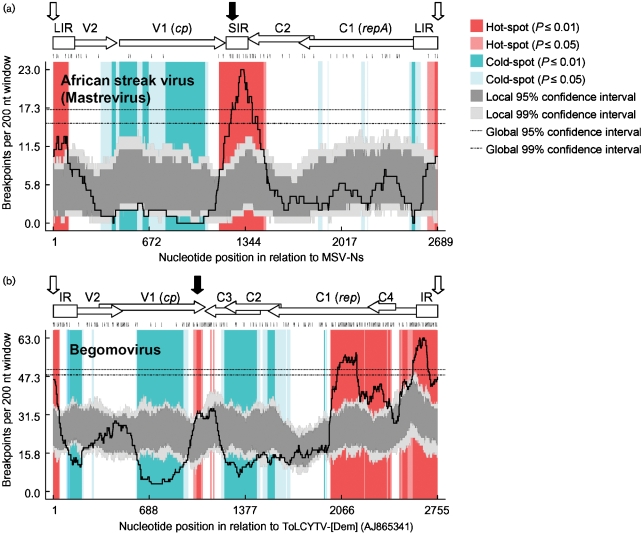
Fig. 2.
Partial conservation of recombination breakpoint distributions across the family Geminiviridae. (a) Breakpoint distribution plot (solid black line) indicating recombination hot- and cold-spots detectable in African streak virus sequences. Broken lines represent 99 and 95 % confidence intervals for the ‘global’ hot-spot test of Heath et al. (2006). Light and dark shaded regions, respectively, represent 99 and 95 % confidence intervals of the ‘local’ hot- and cold-spot test of Heath et al. (2006). (b) Recombination breakpoint distribution plot for the begomoviruses (after Lefeuvre et al. 2007b). Positions of genomic features are indicated above the plots: horizontal arrows labelled V and C, respectively, represent virion and complementary sense genes; boxes labelled IR, LIR or SIR represent intergenic regions. cp, Coat protein gene; rep, replication-associated protein gene; repA, ORF encoding the N-terminal portion of Rep. Vertical black arrows indicate polyadenylation signals of the complementary-sense genes and white arrows indicate the virion-strand replication origin.

