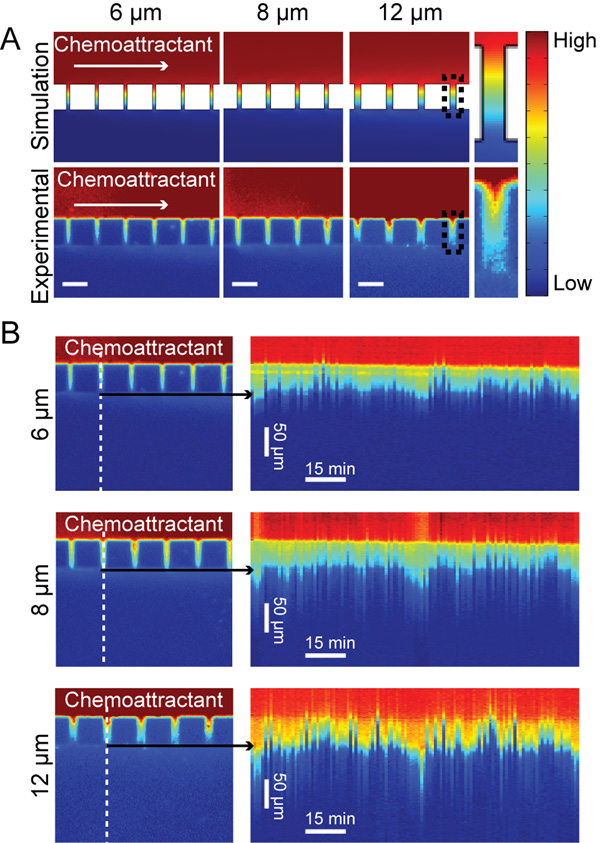
Fig. 2. Chemoattractant establishes a gradient within pores to bias cell migration.
A. Small molecule transport within the chambers was simulated in COMSOL Multiphysics and compared with experimental data using fluoroscein as a marker for the chemoattractant and a 2 µl min−1 flow rate. Experimental data verified that there was a gradient forming across the pores. Black boxes at 12 µm pores indicates pores used for close up view. For fluorescein concentration goes from 0.001% (High) to 0% (Low). B. From the same fluoroscein experiment, time lapse images were used to generate kymographs showing the dynamics of the gradient over time. A line scan (indicated by the dashed line) was taken at each frame of the time series through a single pore. The linescans were then plotted next to each other to generate the kymograph. Kymographs show that the gradient does oscillate slightly over time.

