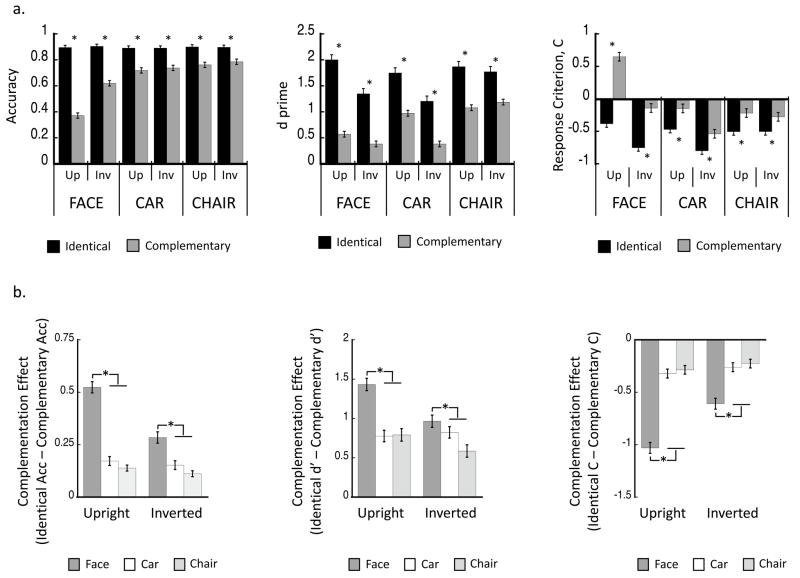
Figure 3.
Experiment 1 results (N=34). (a) Mean values for same-different matching of identical and complementary faces, cars, and chairs presented either upright or inverted are represented using three dependent measures: accuracy for same trials, sensitivity (d′), and response criterion (C). For each orientation of all stimulus categories using both accuracy and d′ measures, subjects were significantly better matching Identical relative to Complementary pairs of images. Error bars represent the standard error of the mean. (b) The CE (Identical – Complementary) associated with accuracy, d′ and C measurements is plotted for upright and inverted faces, cars, and chairs. Error bars represent standard error of the mean.

