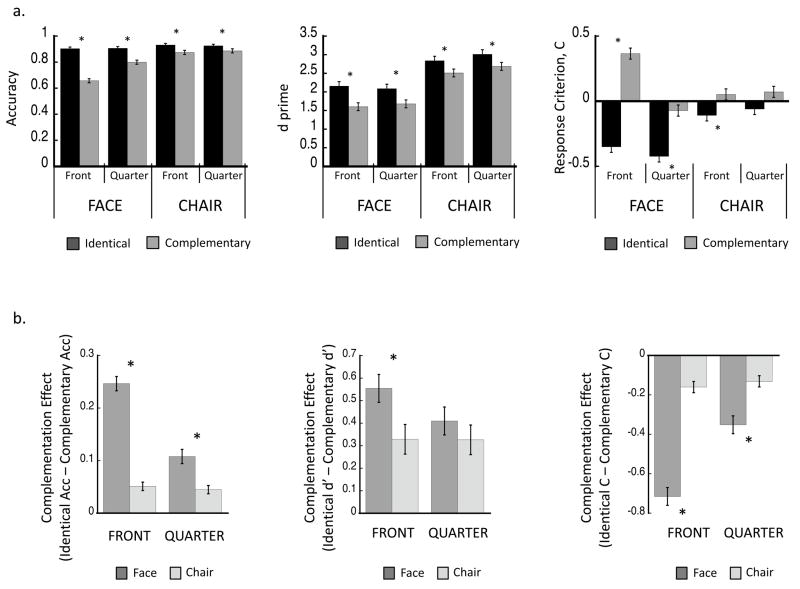
Figure 5.
Experiment 2 results (N=30). (a) Mean values for same-different matching of identical and complementary faces and chairs at either 0° rotation or 45° rotation are represented using three dependent measures: accuracy for same trials, sensitivity (d′), and response criterion (C). Error bars represent standard error of the mean. (b) The CE (Identical – Complementary) associated with accuracy, d′ and C measurements is plotted for 0° and 45° views of faces and chairs. Error bars represent standard error of the mean.

