
Figure 4.
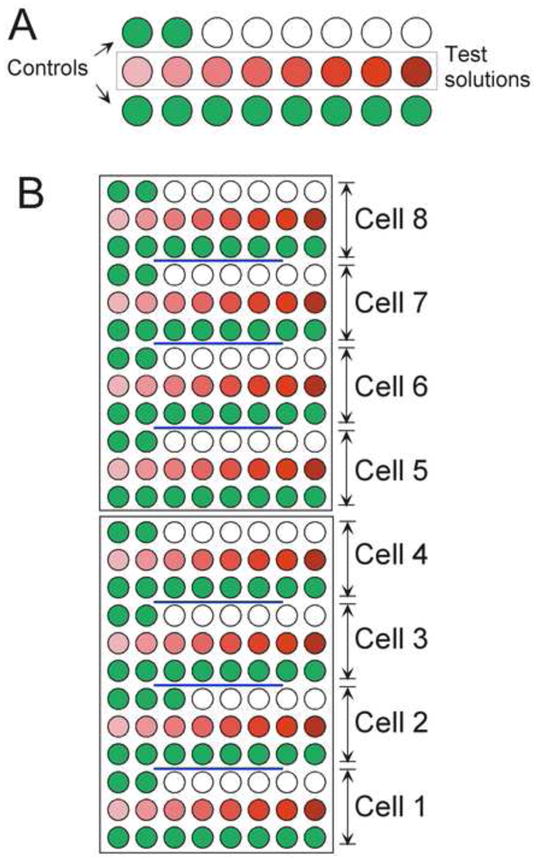
The loaded drug wells for the experiment described by the data sheet in Figure 3. A) The loading of the wells for a single cell. Control solutions are green, experimental solutions are in graduated shades of red. Note that this experiment utilized only 18 out of the possible 24 steps. B) The loading of the two-plate set to provide drug delivery for all eight cells.