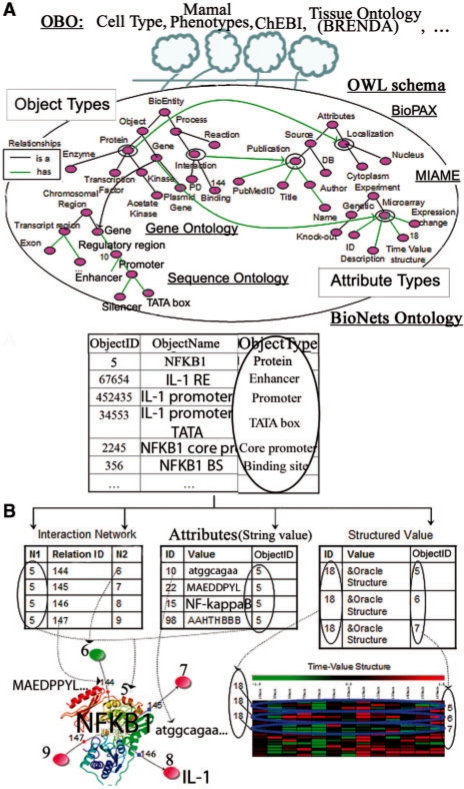
Fig. 2.
IntegromeDB internal database. (A) IntegromeDB Ontology integrating basic BioNets ontology with 34 OBO ontologies, (B) Heterogeneous data of the database and data structures. The color figure at the bottom left (generated in BiologicalNetworks) shows the structure of NFκB-1 protein (ObjectID 5), fragments of NFκB-1 gene and protein sequences (AttributeID 10, 22), as well as genes and proteins (ObjectID 6, 7, 8, 9) interacting with NFκB-1 that are schematically represented by circles. The color figure at the bottom right shows an image from a microarray experiment (ID 18) that involved NFκB-1 gene and its interactors (ObjectID 6, 7).

