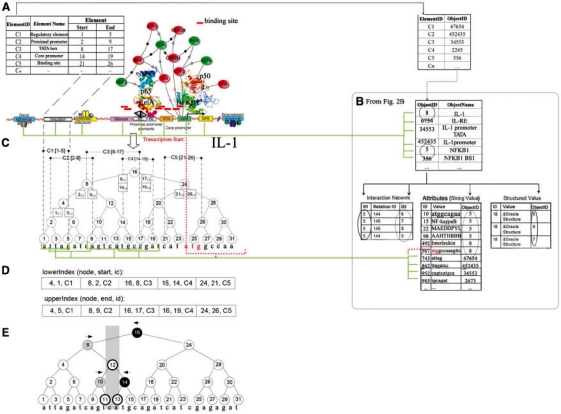
Fig. 3.
Integration of genomic sequences with meta-graph data. (A) Integrated tables and visualization of the final integrated product on the sequence of IL-1 gene (see Fig. 2). (B) Connection of MetaGraph part of the database (from Fig. 2B) to Sequence part of the database. (C) Five sample intervals (regulatory regions) from the IL-1 upstream region for construction of an example RI-tree. Virtual backbone of the RI-tree and registration positions are depicted. (D) Relational indexes lowerIndex and upperIndex. (E) Query preparation step for the query interval (11, 13) (shaded in gray): leftQueries (8, 10), rightQueries (14, 16) and innerQueries (11, 13). The color figure was generated in BiologicalNetworks.

