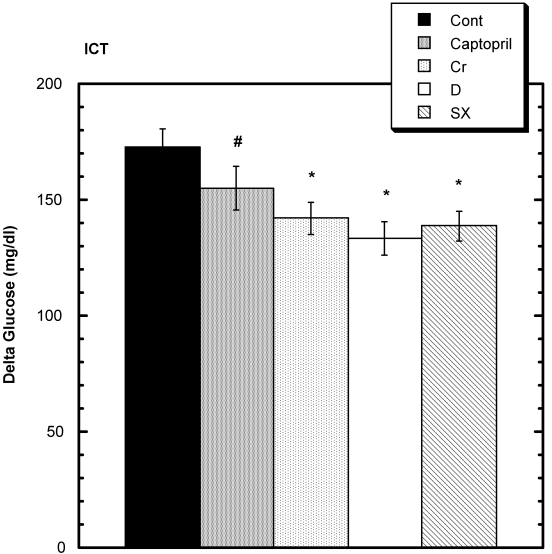
Figure 4.
Elevation of circulating glucose level above baseline 7.5 minutes after i.p. injection of regular insulin and glucose. The elevations are significantly less in the Chromium (Cr) and Maitake D and SX groups signified by the symbol * compared to Control. A trend compared to Control is seen in the Captopril group (#). n=8 in each group. Data are expressed as mean ± SEM.

