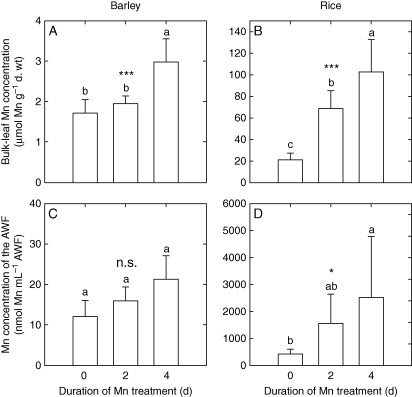
Fig. 1.
Bulk leaf Mn concentrations and Mn concentrations of the AWF of the second oldest leaves of barley and rice. After pre-culture at 0·2 µm Mn, the Mn supply was increased to 50 µm for 0, 2 and 4 d, or plants received 0·2 µm Mn continuously. Results of one-factorial ANOVA are given as ***, * and n.s. for P < 0·001, 0·05, and not significant, respectively. Means with different letters indicate significant differences at P < 0·05 (Tukey test).

