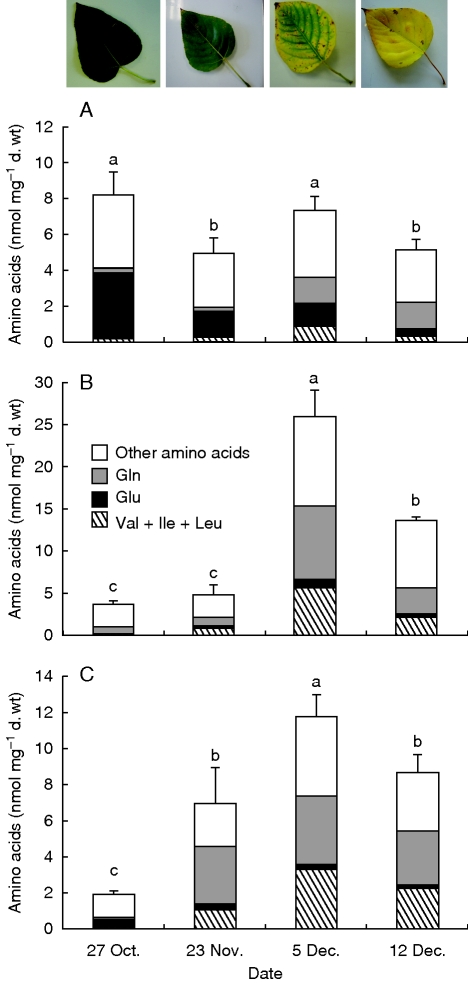
Fig. 1.
Quantification of amino acids by gas chromatography–mass spectrometry in (A) laminae, (B) central veins (C) and petioles of poplar during senescence. Values are expressed as the mean ± s.e. of three replicate experiments. For a given tissue, amino acid concentration values with the same letter are not significantly different, according to ANOVA at P < 0·05.

