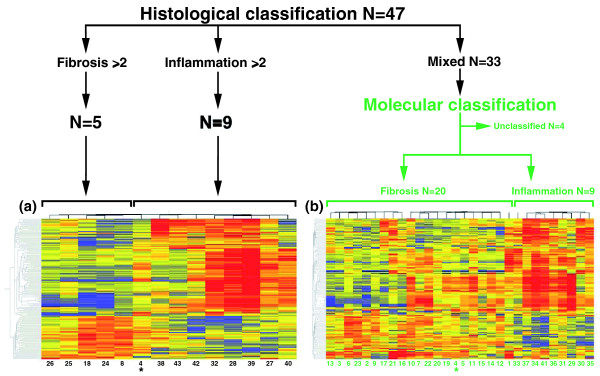
Figure 2.
Assignment of infants with biliary atresia into groups of inflammation or fibrosis at diagnosis. When the differences in histological scores were ≥2, 5 of 47 livers had advanced fibrosis and 9 had predominant portal inflammation (black lines). These 14 livers displayed 150 gene probes that were differentially expressed between the fibrosis and inflammation groups (P < 0.05; Welch's t-test and 5% FDR - depicted as cluster analysis in (a)). Applying this expression signature to the 33 subjects classified histologically as 'mixed' (or unclassified), PAM assigned 29 subjects into groups of fibrosis or inflammation (N = 20 and N = 9, respectively) (b). The cluster analyses depict gene expression as a color variation from red (high expression) to blue (low expression); yellow displays similar level between the groups. The numbers below the columns denote individual patients (listed in Additional file 3). *Patient 4 is included in both cluster analyses because PAM reclassified the liver into the fibrosis group.

