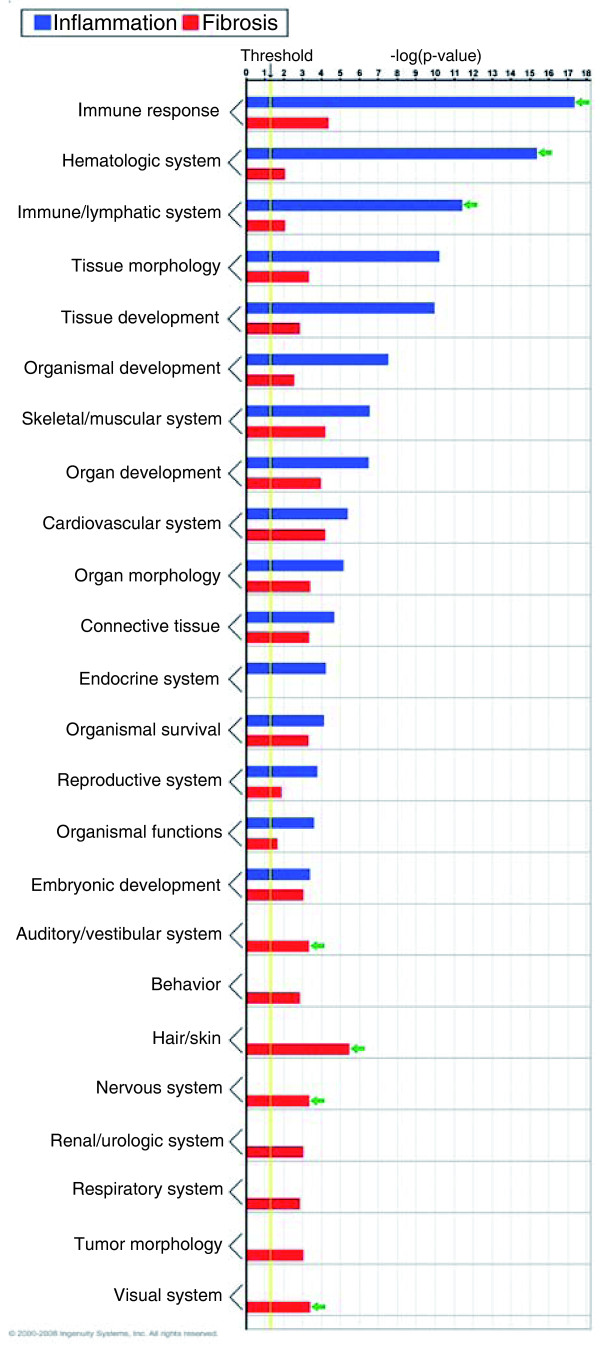
Figure 5.
Functional grouping of genes that are up-regulated in inflammation (N = 77 genes) or fibrosis (N = 38 genes) groups using Ingenuity Pathways Analysis. Enrichment scores are represented as -log(P-value), with a threshold of 1.3 as the cut-off for significance (P < 0.05). Green arrows point to predominantly involved processes.

