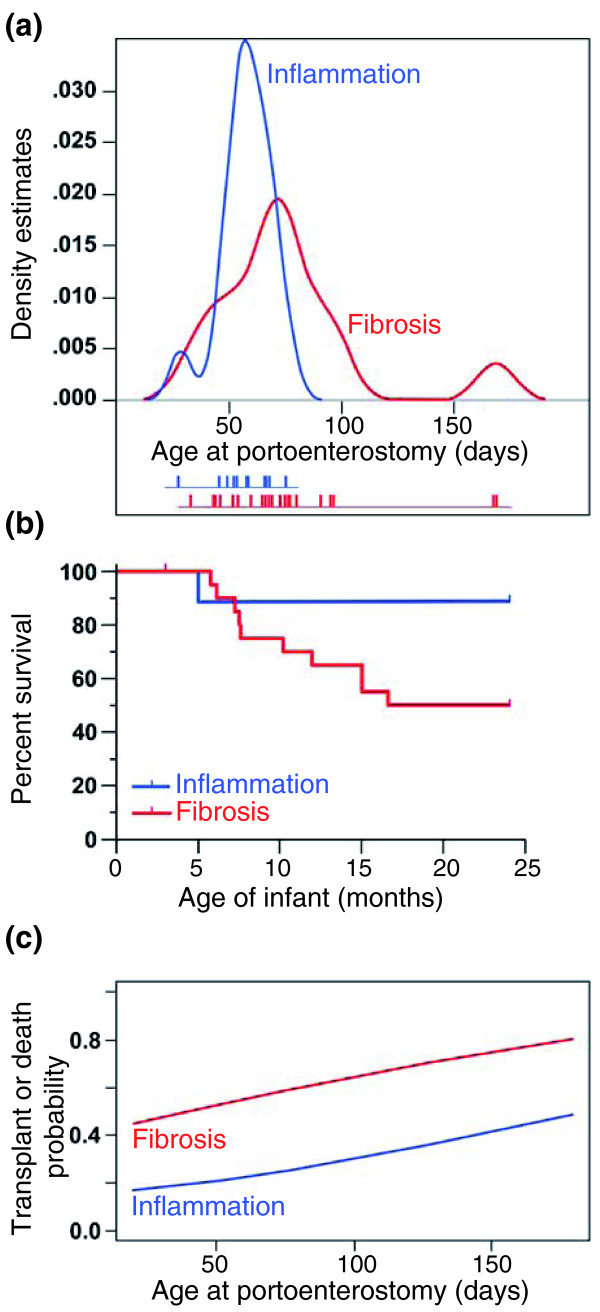
Figure 7.
Relationship between molecular groups and clinical features. (a) The probability density function of age at the time of surgery (Kasai procedure) in relation to molecular signatures of inflammation or fibrosis in biliary atresia. The age of individual patients is shown below the graph as short vertical bars. (b) Kaplan-Meier analysis shows a decreased survival with the native liver in infants with the fibrosis signature (P = 0.04). (c) Logistic regression modeling depicts the effect of age on the association between molecular groups and the probability of transplant or death by 2 years of age (P = 0.079).

