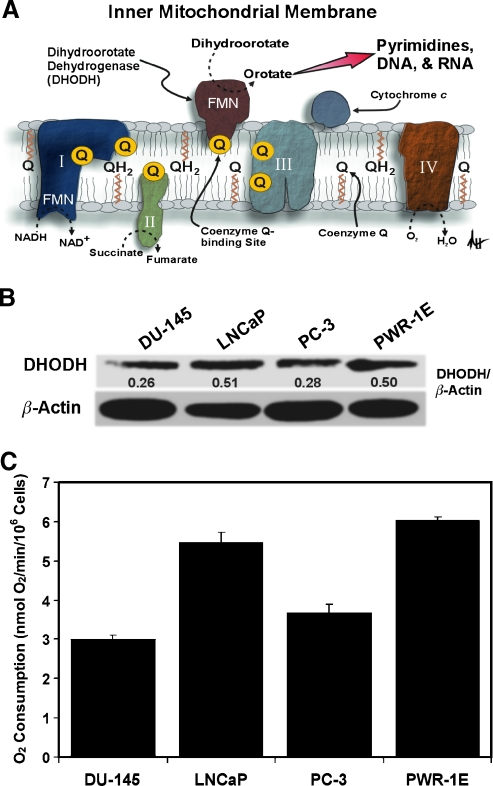
Figure 1.
An assessment of DHODH expression and oxygen consumption in transformed prostate epithelial cells. (A) A diagrammatic depiction of DHODH in the inner mitochondrial membrane illustrating its role in mitochondrial bioenergetics and de novo pyrimidine synthesis. Please refer to the text for additional details (I indicates complex I; II, complex II; III, complex III; IV, complex IV; FMN, flavin mononucleotide). (B) An immunoblot analysis of DHODH expression for the DU-145, LNCaP, PC-3, and PWR-1E cells. The DHODH band intensity was normalized as a percentage of the loading control β-actin using ImageJ software. (C) The oxygen consumption rates (nmol of O2/min) were determined for approximately 106 cells.

