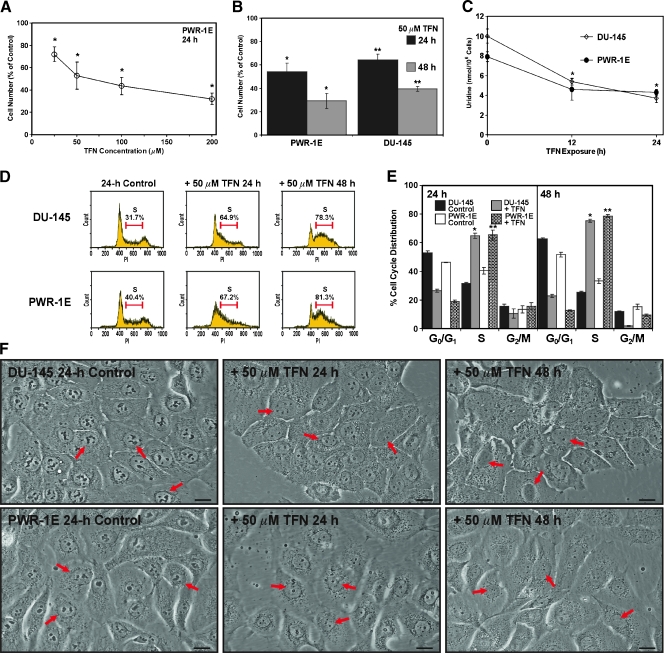
Figure 2.
TFN inhibits proliferation and decreases cellular uridine levels in PWR-1E and DU-145 cells. (A) The PWR-1E cells were treated for 24 hours with the indicated concentrations of TFN or an equal volume of the vehicle Me2SO (control) dissolved in fresh culture medium. The cells were harvested and counted with a hemacytometer. The relative cell number in the TFN-treated populations is presented as a percentage of the 24-hour control. P < .001 compared with control. (B) The PWR-1E and DU-145 cells were cultured, harvested, and counted as described in panel (A) after 24- and 48-hour exposures to 50 µM TFN or Me2SO (control). *P < .01 compared with the respective PWR-1E controls; **P < .01 compared with the respective DU-145 controls. (C) An assessment of the uridine levels in the DU-145 and PWR-1E cells after exposure to 50 µM TFN for the indicated times or Me2SO (control, 0-hour TFN exposure). *P < .01 compared with the 0-hour DU-145 or PWR-1E control. (D) Representative PI (DNA) histograms for the treatments described in panel (B). The percentages of S-phase cells are presented above the histograms. (E) A summary of the cell cycle analyses for the treatments described in panel (B). *P < .001 compared with the respective DU-145 controls; **P < .001 compared with the respective PWR-1E controls. (F) DU-145 and PWR-1E cells were imaged at the indicated times after treatment with 50 µM TFN or Me2SO (control). The arrows in the differential interference contrast images point to the cell nucleus. Scale bars, 18 µm.

