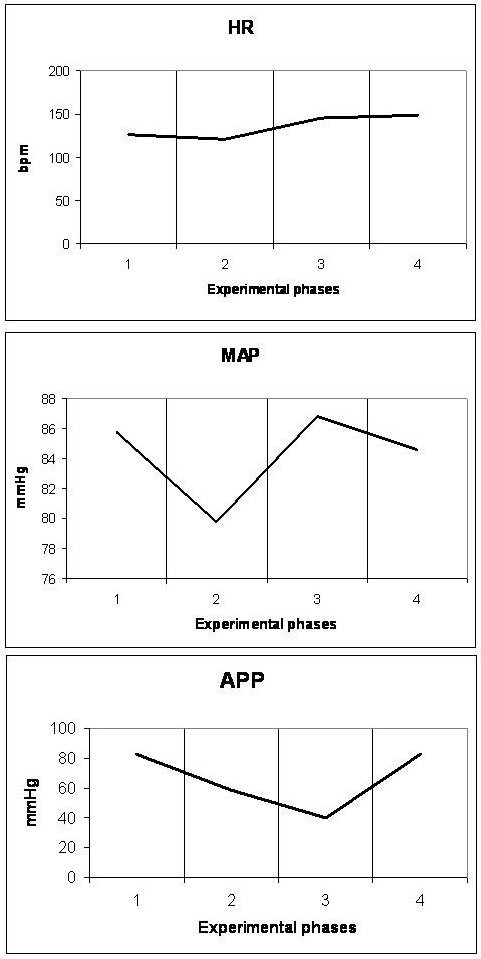
Figure 2.

Diagrammatic presentation of alterations of heart rate (HR), mean arterial pressure (MAP) and abdominal perfusion pressure (APP). These changes occurred during the four experimental phases (1: baseline, 2: IAP 20 mmHg, 3: IAP 45 mmHg and 4: abdominal desufflation).
