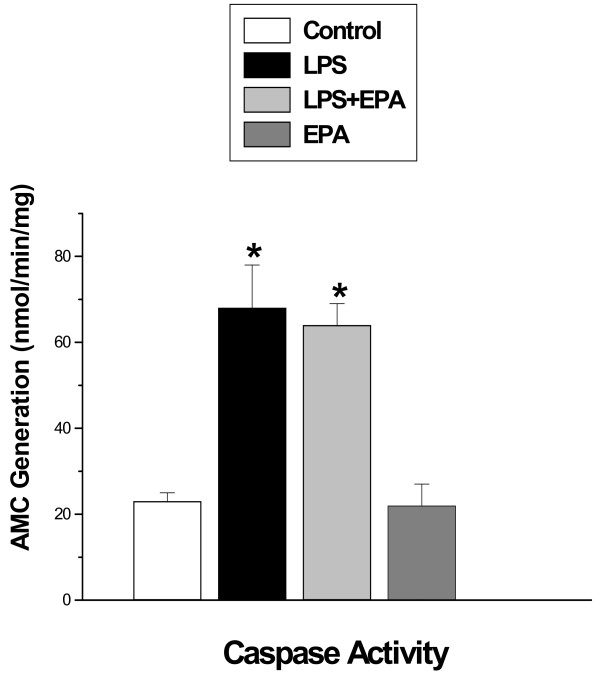
Figure 2.
Diaphragm caspase 3 activity. Diaphragm caspase 3 activity was significantly increased for samples taken from animals after LPS treatment (filled bar) as compared to controls (open bar) (P < 0.01). EPA administration did not prevent this increase in diaphragm caspase 3 activity, with caspase 3 activity higher for the EPA plus LPS group (light grey bar) as compared to controls (P < 0.01). This parameter was similar in control and the EPA alone group (dark grey bar) and the EPA alone group was different from the LPS alone group (P < 0.01). * indicates a significant statistical difference compared to control and EPA alone groups.

