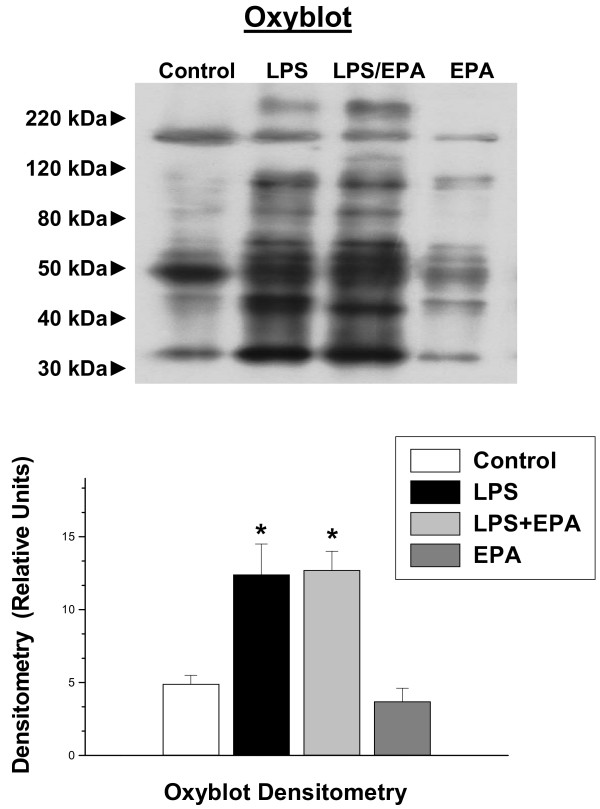
Figure 3.
Oxyblot determination. Diaphragm protein carbonyl content, as assessed by the oxyblot technique, is shown for representative diaphragm samples in the top blots while group mean densitometry data is presented in the bottom graph. Protein carbonyl levels were increased for diaphragm samples taken from animals after LPS treatment as compared to control animals (P < 0.01). EPA administration did not reduce carbonyl levels significantly in LPS treated animals. Carbonyl levels for animals given EPA alone were similar to levels in saline treated controls. * indicates a significant statistical difference compared to control and the EPA alone groups.

