Figure 4.

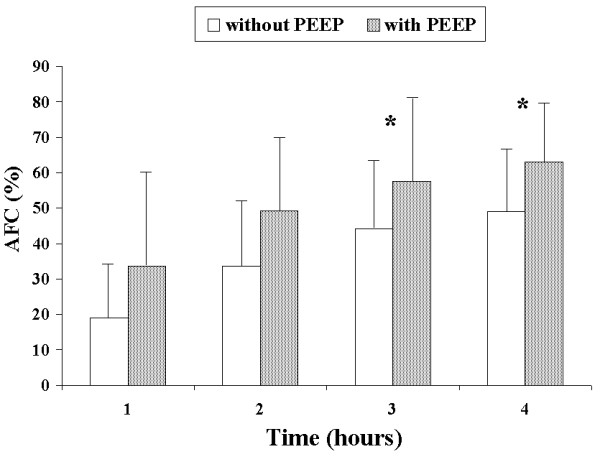
Comparison of alveolar fluid clearance (percentage with respect to initial edema) between groups with and without PEEP. Each bar represents the mean ± SD. *P < 0.05 between groups.

Comparison of alveolar fluid clearance (percentage with respect to initial edema) between groups with and without PEEP. Each bar represents the mean ± SD. *P < 0.05 between groups.