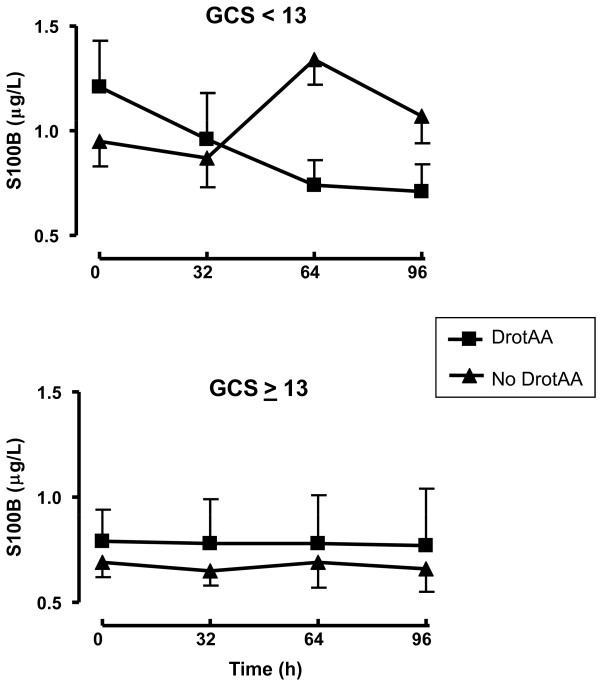
Figure 1.
S100B levels in patients with GCS <13 and GCS ≥ 13, with or without DrotAA treatment. * P < 0.05 as compared to baseline S100B levels in DrotAA-treated patients; °P < 0.05 DrotAA-treated vs. -untreated patients. Values are means ± SEM DrotAA: drotrecogin alfa (activated); GCS: Glasgow Coma Scale; SEM: standard error of the mean.

