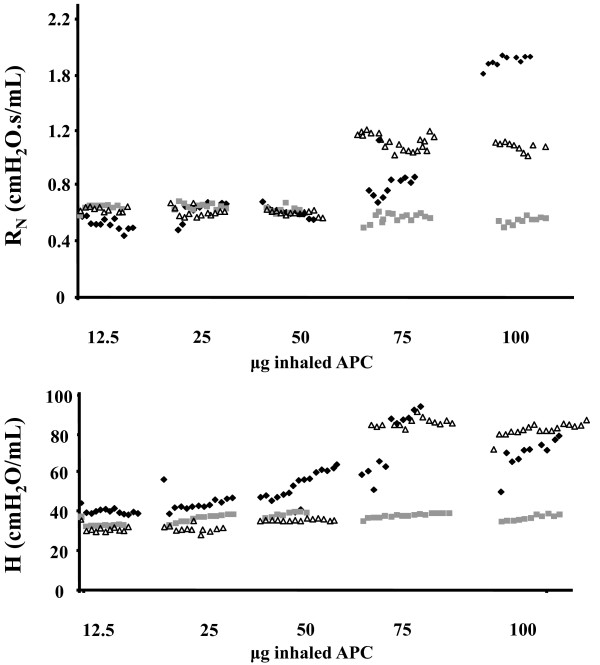
Figure 1.
Dose-response curve of airway resistance (RN) and lung tissue elastance (H) to inhaled APC. Increasing doses ranging between 12.5 and 100 μg of inhaled activated protein C (APC) were administered to three mice and lung function was measured every 10 seconds. Airway resistance (RN, top) and lung elastance (H, bottom) started to increase at 25 μg. We therefore used 12.5 μg for the remaining experiments. The symbols (square, diamond and triangle) represent measurements obtained from each of the three mice used in this experiment.

