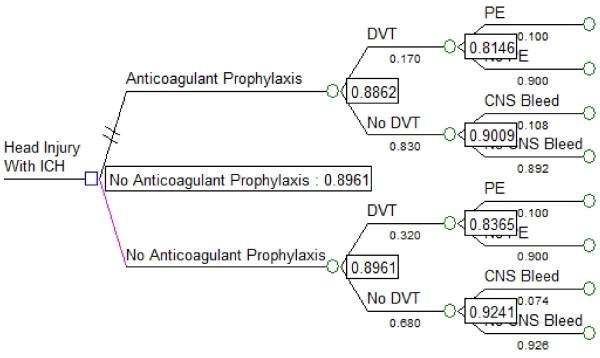
Figure 4.
Results of decision analysis. The square node at the extreme left represents the decision node and the circles represent chance nodes. Numbers in boxes are the final calculated expected value at each chance node. The overall expected value associated with withholding anticoagulation prophylaxis (0.8961) is similar to that associated with the anticoagulant prophylaxis strategy (0.8862), indicating the choice is a toss-up. CNS Bleed: progression of intracranial hemorrhage; DVT: deep vein thrombosis; ICH: intracranial hemorrhage; PE: pulmonary embolism.

