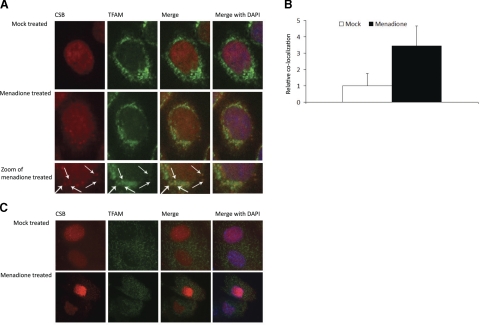
Figure 1.
Colocalization of CSB with TFAM in menadione treated cells. A) HeLa cells either mock treated or treated with 200 μM menadione were stained for endogenous CSB and TFAM. Colocalization in the merged fields appears as yellow foci (arrows). B) Colocalization was quantified using Volocity software. Solid bar, fold increase in colocalization of CSB to TFAM after menadione treatment; open bar, mock treatment. Results from one representative experiment are shown. C) Primary human skin fibroblast cells either mock treated or treated with 200 μM menadione were stained for endogenous CSB and TFAM. Colocalization in merged fields appears as yellow foci.

