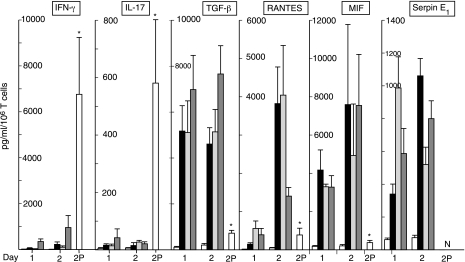
Figure 3.
Generation of immune cytokines by purified CD4−8− T cells. Columns and bars depict mean ± sd results of studies of CD4−8− T cells on d 1 and 2 or of CD4 + CD8 T cells on d 2 (bar 2P) from 5 healthy human donors, expressed as pg/ml/106 T cells. Repetitive sets of 4 columns for CD4−8− T cells on d 1 and 2 represent, in order from left to right: no stimulus, anti-CD3 + anti-CD28 antibodies, anti-CD3 + anti-CD161 antibodies, and IL-12 (5 ng/ml)+ IL-18 (50 ng/ml). Single 2P bar in each frame depicts values on d 2 for CD4 + CD8 T cells from 5 donors (IFN-γ and IL-17) or 3 donors (other cytokines) stimulated with anti-CD3 + anti-CD28 antibodies. *P < 0.01 vs. d 2 level for anti-CD3 + anti-CD28 antibody-stimulated CD4−8− T cells. N for the Serpin E1 2P bar indicates not detectable.

