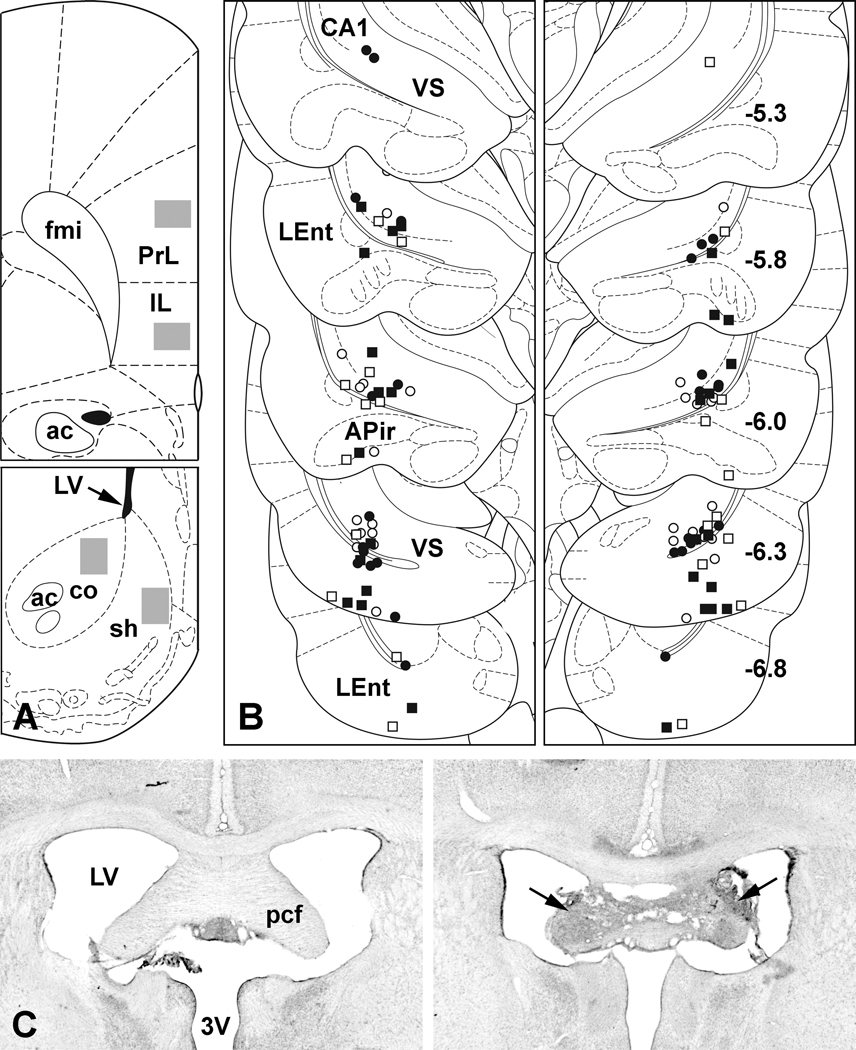
Figure 1.
A. Examples of regions sampled (gray rectangles) for c-Fos-protein expression in infralimbic (IL) and prelimbic (PrL) cortices of the mPFC (Top) and in the core (co) and shell (sh) of the NAC (Bottom). B. Summary plot of VH infusion sites: open symbols represent vehicle infusions, filled symbols NMDA infusions; square symbols represent bilaterally lesioned cases, round symbols unlesioned cases. Each side of the bilateral infusions is represented in a separate panel. More rostrally (upper levels), placements are confined primarily to the boundary region of CA1 and ventral subiculum (VS). Some of the more caudal placements (lower levels) can be seen in the lateral entorhinal cortex (LEnt). Occasionally an infusion track penetrates the amygdalopiriform transition area (APir) of the caudal amygdala. Numbers in the right panel represent A/P levels relative to Bregma. Except for a few outliers, nearly all of the placements were between −5.8 and −6.3 mm. C. Nissl-stained examples of the precommissural fornix (pcf) from a case with no fornix lesion (Left) and from one that received bilateral electrolytic lesions (arrows) of the pcf (Right). In this case, only a small amount of tissue appears intact at the midline, and our previous work (Miller et al., 2010) has demonstrated that fibers projecting from the VH pass along the lateral edges of the pcf. 3V, third ventricle; ac, anterior commissure; fmi, forceps minor of the corpus callosum; LV, lateral ventricle. Figures A and B are derived form a standard rat brain atlas (Paxinos and Watson, 1998).

