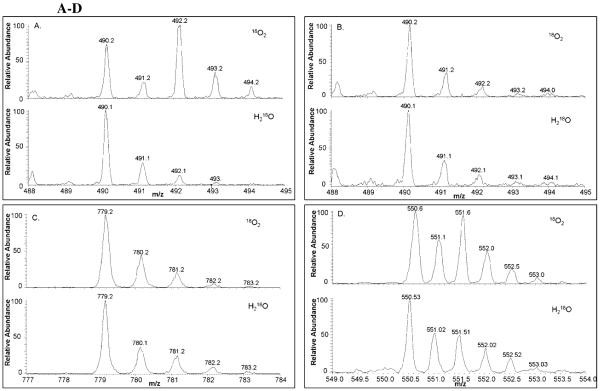
Figure 6 A-D.
Positive ESI Zoom scan mass spectra of raloxifene metabolites and GSH conjugates from the incubation of raloxifene with CYP3A4 in the presence of 18O2 or H218O. Maximal possible 18O incorporation in the raloxifene metabolites was determined to be 45% from 18O2 and 50% from H218O by measuring the 18O incorporated into the controls, 6β-hydroxytestosterone and 2-chloronicotinolyl acid, respectively. The isotope patterns are shown for (A) 3′-OHRA, (B) 7-OHRA, (C) GS-RA, and (D) di-GS-OHRA.

