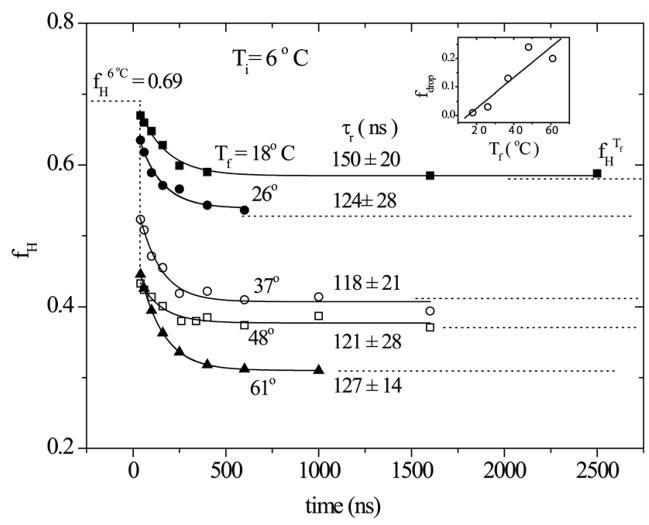
Figure 8.
T-jump induced time-resolved helical content change (ΔfH) obtained from two-state spectral modeling of the UVRR spectra for aqueous Ac-GSP peptide at the indicated Tf following T-jumps from 6 °C. The continuous line corresponds to a single exponential fit. Dotted lines indicate the equilibrium helix fractions at 6°C and at the final temperature following the T-jump. The inset plots the magnitude of the initial drop in helicity as a function of Tf.

