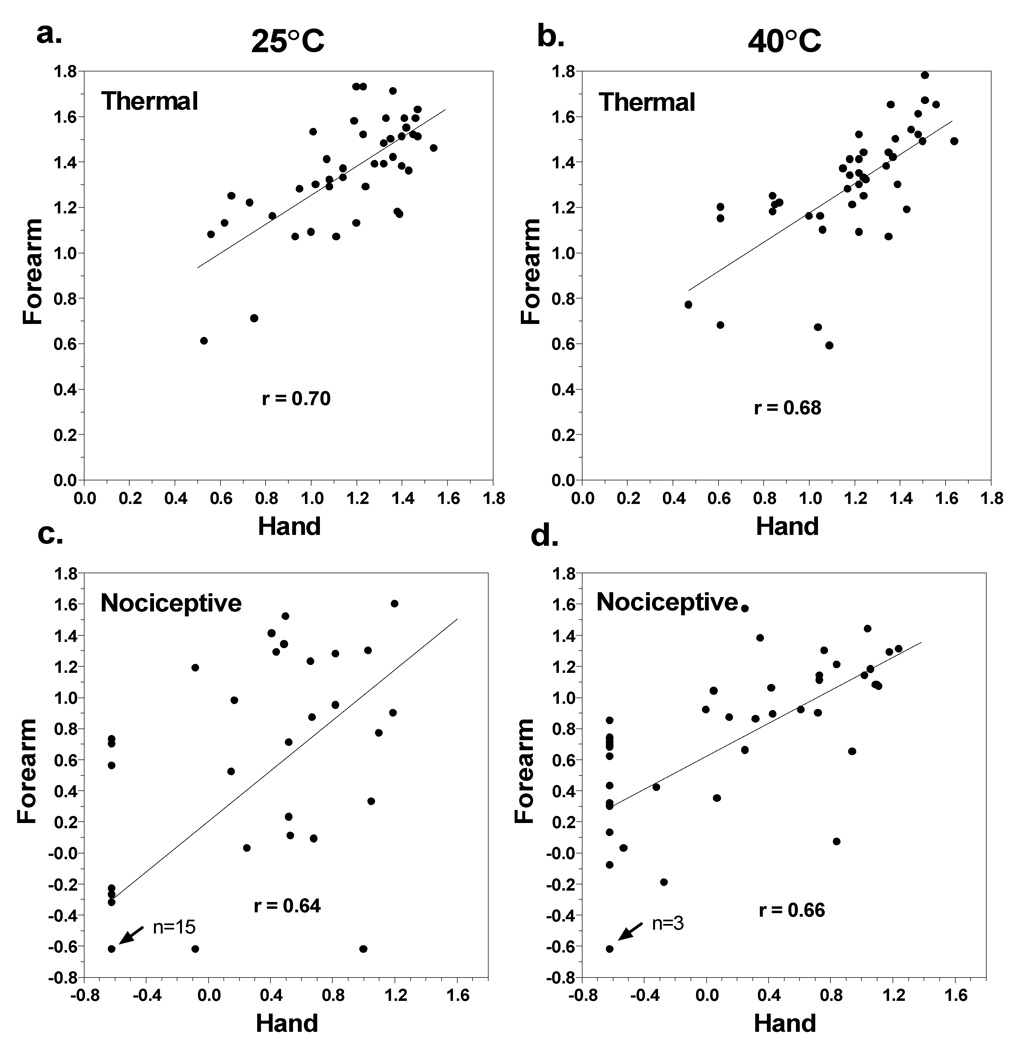
Fig. 3.
Scatterplots are shown that compare log-mean ratings of thermal (top) and nociceptive (bottom) sensations given by individual subjects to the 25° and 40°C stimuli presented to the hand versus the forearm. Least-squares best fit lines are shown for each data set together with Pearson r correlation coefficients. In graphs (c) and (d), n = 15 and n = 3 refer to the number of subjects who reported no nociceptive sensations on either the forearm or the hand in response to the 25° and 40° stimuli, respectively.

