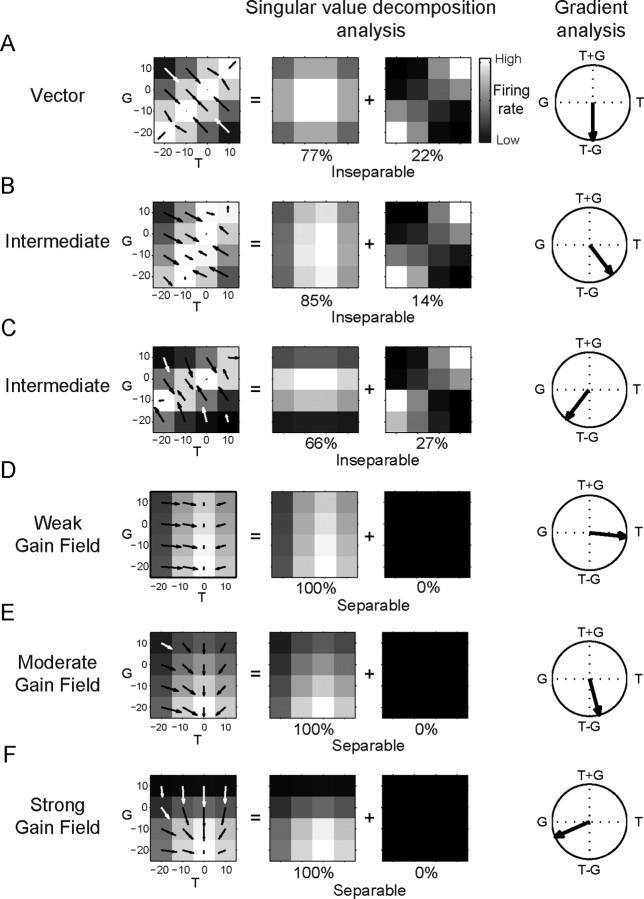
Figure 2.
Example simulated responses and analysis. A, Vector response field f(G, T) = f(T − G) decomposed by singular value decomposition analysis and gradient analysis. The first two matrix responses in the singular value decomposition are shown. The fraction of the total variance they capture is given beneath each matrix. The response field orientation from the gradient analysis is shown on the rightmost column. B, Intermediate response field. f(G, T) = f(T − G/2). C, Intermediate response field. f(G, T) = f(T − 2G). D, Weak gain field of eye position modulating target position coding. E, Moderate eye position gain field. F, Strong eye position gain field. White, High firing rate. Black, Low firing rate. For the response field orientation, 0° points right and angles increase counterclockwise.

