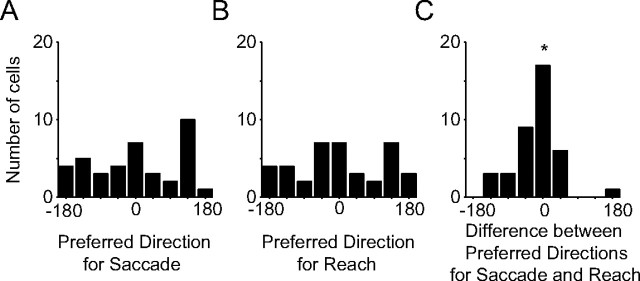
Figure 5.
Population histograms preferred directions of PMd neurons. A, Histogram of preferred direction of activity during delay period before saccades. B, Histogram of preferred direction of activity during delay period before reaches. C, Histogram of difference in preferred directions during delay periods before saccades and reaches. Asterisk marks the mean preferred direction difference. Preferred directions before a reach and saccade point in similar directions.

