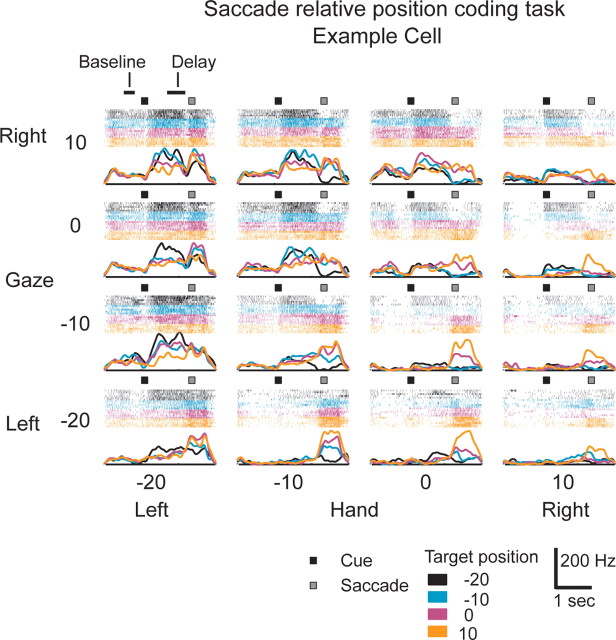
Figure 7.
PMd example cell responses to the saccade relative position-coding task. Activity is aligned to target onset (black square) as gaze position is varied (rows), hand position is varied (columns), and target position is varied (within each panel). Gaze (G), hand (H), and target (T) positions are shown above each panel. Spike rasters are shown above the panel color coded for each target position in that panel. Target onset time (black square) and mean saccade time (gray square) are shown on each panel. Horizontal bars on the top left panel indicate the baseline and delay period analysis intervals.

