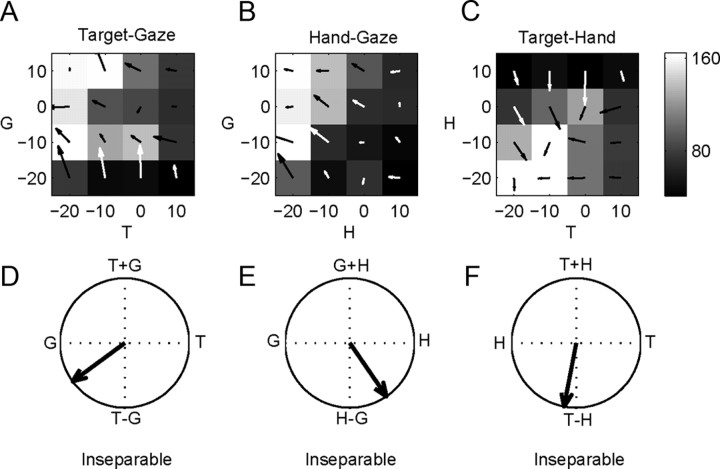
Figure 8.
PMd example cell response matrices during the saccade relative position-coding task. A, Target–gaze response matrix during the delay period at the peak of the response field. The hand is at −20°. Arrows show the two-dimensional gradient elements. B, C, Similar for hand–gaze and target–hand response matrices with the target at −20° and gaze at 10°, respectively. D, Overall response field orientation for the TG response matrix, −144°. E, Overall response field orientation for the HG response matrix, −56°. F, Overall response field orientation for the TH response matrix, −101°. 0° points right and angles increase counterclockwise.

