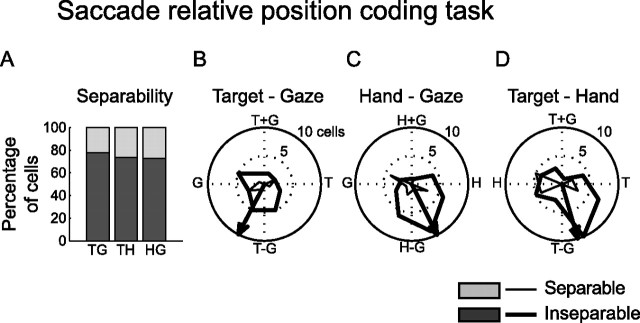
Figure 9.
Population gaze–hand–target analysis during the delay period. A, Population separability for all PMd cells with tuned delay or movement period responses. The percentage of inseparable cells is show in dark gray. The percentage of separable cells is shown in light gray. B–D, Target–gaze response field orientation (B), hand-gaze response field orientation (C), and target–hand response field orientation (D) for tuned PMd neurons. Orientations for separable cells are shown in thick lines. Orientations for inseparable cells are shown in thin lines.

