
Figure 2. A unique DNA binding mode.
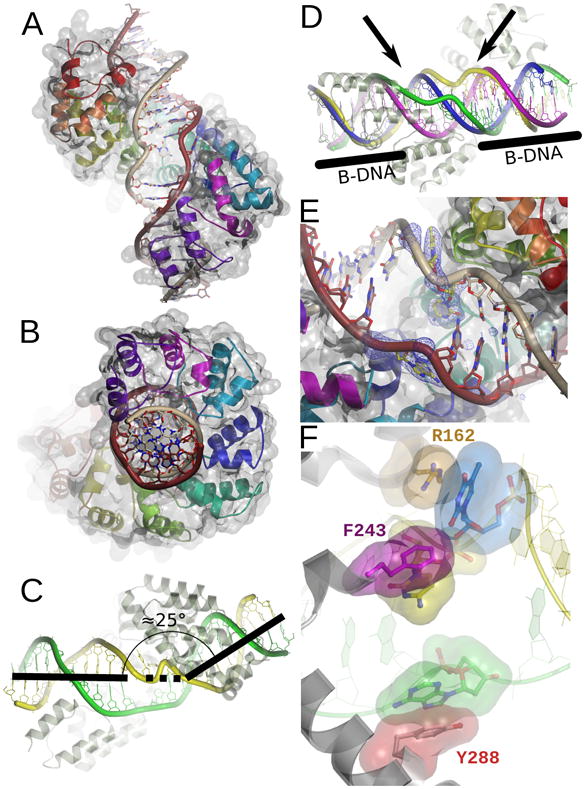
A. Global view of the protein-DNA interaction. Each repeated mterf motif is colored as in Figure 1. The light strand is brown and the heavy strand is gray. The molecular surface is rendered transparent. B. A 90° rotation of the view in A. C. MTERF1 induces a 25 bend in the DNA molecule. The light strand is green and the heavy strand is yellow. D. MTERF1 unwinds the DNA double-helix. Overlay between the DNA observed in the crystal structure (the heavy and light strands are green and yellow, respectively) and ideal B-form DNA (magenta and blue). The ends of the DNA molecule adopt B conformation (black bars). The central part of the molecule (black arrows) is unwound. E. Three nucleotides (yellow in the figure; corresponding to A3243 of the light strand and T3243 and C3242 of the heavy strand) are everted from the double-helix in the central part of the structure. A simulated annealing fo-fc electron density map is shown contoured at 3σ. F. The three everted nucleotides are stabilized by π-stacking interactions. R162 (orange), F234 (magenta) and Y288 (red) stack against each of the everted nucleotides (color coded as in B). The light strand is green and the heavy strand yellow.