
Figure 3. Interactions of MTERF1 with DNA.
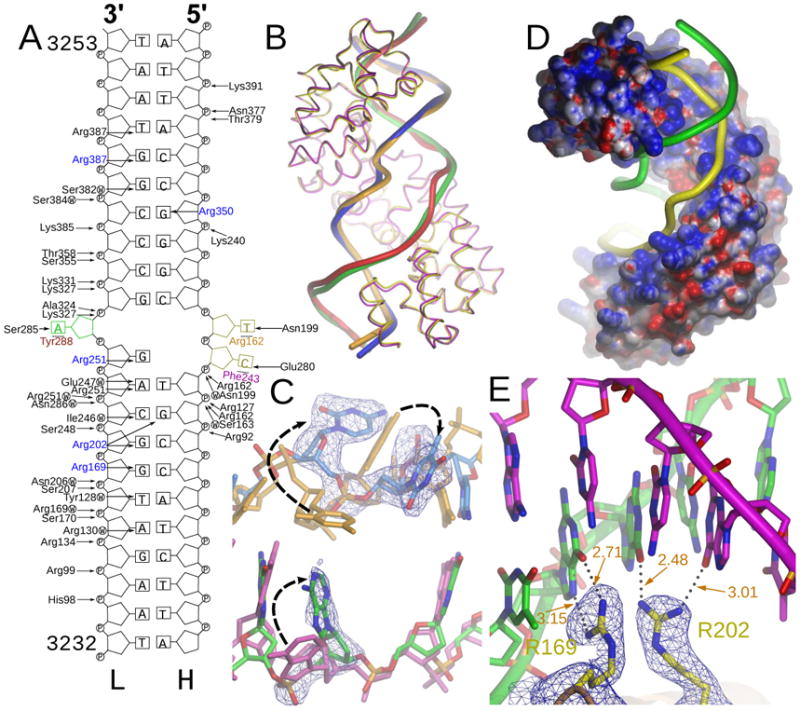
A. Scheme of the interactions between MTERF1 and the double-stranded DNA. Each interaction is listed with an arrow pointing either to the phosphate or to a DNA base. The three everted nucleotides and the residues that stack with them are colored. The five arginine residues that determine sequence specificity are shown in blue. W indicates a water mediated interaction. B. Overlay of C-α traces of WT (yellow) and triple mutant (magenta) structures. The DNA backbone is also shown for each of the DNA strands. The WT light and heavy strands are colored red and orange, respectively. The mutant DNA strands are colored green (light) and blue (heavy). C. Overlay of the central part of the DNA duplex in the WT and mutant structures. The three nucleotides that are everted in the WT structure are shown. The mutant heavy strand is blue, while the light strand is green. A simulated-annealing fo-fc omit electron density map is shown, contoured at 3σ. The DNA in the WT structure is shown as a reference. The WT heavy strand is shown in brown while the light strand is magenta. Black arrows indicate the changes in the position of the everted nucleotides that are observed upon mutation of the three stacking residues. D. Electrostatic surface potential of MTERF1. The protein surface is shown, colored between −10 kT e−1 (red) and 10 kT e−1 (blue). The DNA backbone is shown in yellow (light strand) and green (heavy strand). E. Sequence recognition by arginine residues. Five arginine residues determine sequence recognition by MTERF1. A representative example showing how R169 and R202 interact with their partner guanine residues. The R202 interaction is atypical in that only one hydrogen bond is established with the guanine base. Hydrogen-bonding distances are shown in orange. A simulated annealing fo-fc electron density map is shown contoured at 4σ. See also Figure 2S.