
Figure 4. DNA binding measurements.
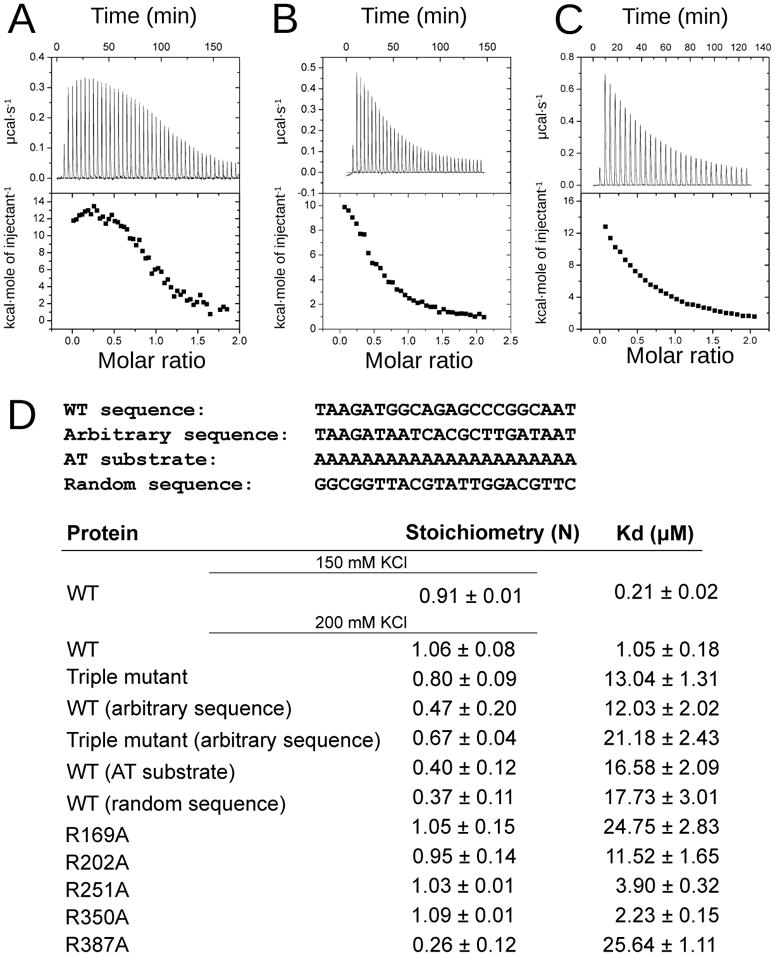
ITC data from the titration of the leu-tRNA MTERF1 binding sequence into wt MTERF1 (A), the triple R162A-F243A-Y288A mutant (B) or the R387A mutant (C). D. Summary of the observed binding constants. The sequence of each substrate (one of the strands) is indicated at the top of the table. See also Figure 3S.