
Figure 6. The ALPS domain of Nup133 is critical for the proper localization of Nup133 and Nup107 to the NE.
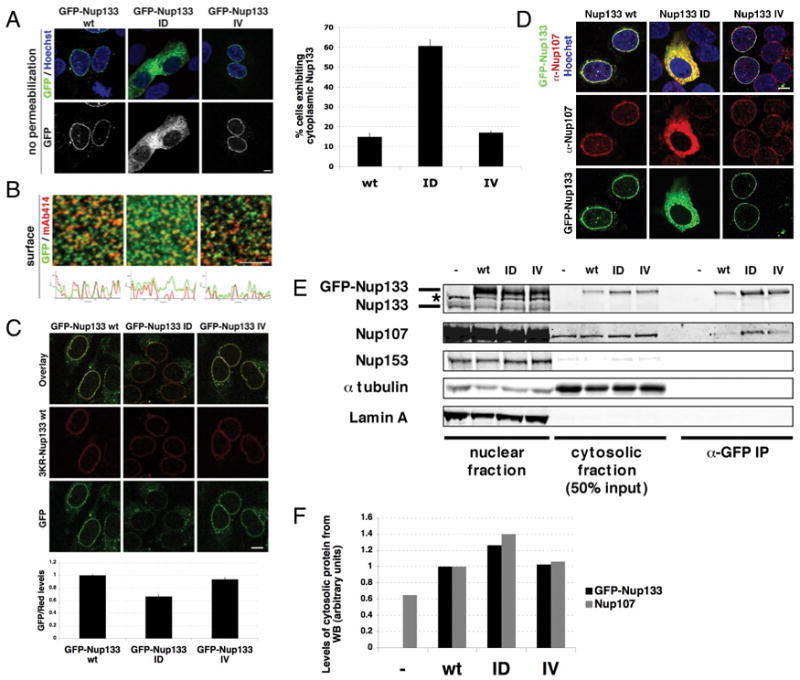
(A) U2OS cells were transfected with GFP-mNup133 wt, GFP-mNup133 ID or GFP-mNup133 IV (green) for 72h, fixed and stained with Hoechst (blue). The percentage of cells exhibiting cytoplasmic GFP signal 72h after transfection with either GFP-mNup133 wt, ID or IV is shown in the right panel. (B) U2OS cells were transfected as in (A), fixed and stained with mAb414. Histograms show co-localization of GFP and mAb414 signal at the nuclear surface (lower panels). (C) U2OS cells were co-transfected with mNup133 wt fused to a red fluorescent tag (3KR-Nup133) and either GFP-mNup133 wt, ID or IV for 72h. Plasmamembranes were permeabilized with digitonin 72h after transfection and fixed. The ratio of green and red fluorescence signals at the NE were quantified and normalized to the ratio of GFP-mNup133 wt/3KR-mNup133 wt (lower panel). (D) U2OS cells were transfected as in (A), then fixed and stained with α-Nup107 (red). (E) U2OS cells were transfected with GFP-mNup133 wt, ID or IV and collected after 48h. Cytosolic fractions were obtained by hypotonic cell lysis and nuclei were lysed in denaturing buffer. GFP fusion proteins were immuno-precipitated from the cytosolic fraction with an α-GFP antibody; untransfected cells served as a control. The nuclear, cytosolic fractions and immunoprecipitates were analyzed by Western Blotting using specific antibodies against Nup133, Nup107, Nup153 (mAb414), tubulin (cytosolic marker) and lamin A (nuclear marker). (F) Quantification of GFP-Nup133 and Nup107 levels in the cytosolic fractions, normalized to tubulin levels. All scale bars 10 μm. See also Figure S6.