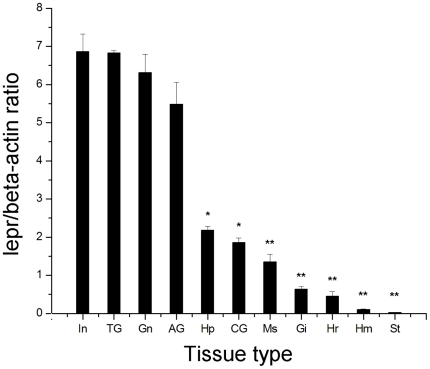
Figure 5. Tissue distribution of the lepr transcript measured by SYBR Green RT-PCR.
Quantitative analysis of lepr gene expression relative to β-actin expression in different mitten crab tissues. Lepr gene expression was analyzed in the following tissues: In – intestine, TG – thoracic ganglia, Gn – gonad, AG – accessory gonad, Hp – hepatopancreas, CG – cranial ganglia, Ms – muscle, Gi – gill, Hr – heart, Hm – haemocytes and St – stomach. Expression data for each tissue were analyzed from three individual crabs. Vertical bars represent the mean ± S.E. (n = 3). Significant differences relative to controls are indicated with an asterisk (P<0.05) or with two asterisks (P<0.01).

