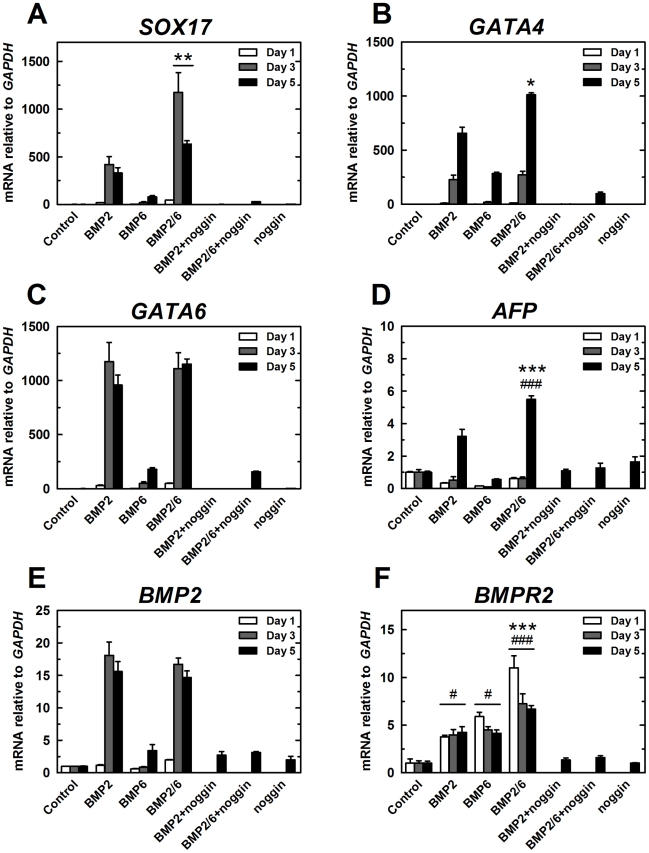
Figure 4. qPCR expression analysis of differentiation markers after treatment with BMPs (II).
H9 cells were treated with BMP-2, BMP-6 or BMP-2/6 at 100 ng/ml in mTeSR1 for 1, 3 or 5 days. Noggin 1 µg/ml was used as antagonist. After 5 days of treatment, qPCR was used to analyze expression of differentiation markers. qPCR values correspond to relative expression compared to GAPDH mRNA. As control, cells growing in mTeSR1 were used. Treatments were repeated at least in three different experiments, and results are expressed as average ± SD. A, SOX17. B, GATA4. C, GATA6. D, AFP. E, BMP2. F, BMPR2. (*) P<0.05 BMP-2 vs. BMP-2/6; (**) P<0.01 BMP-2 vs. BMP-2/6; (***) P<0.001 BMP-2 vs. BMP-2/6; (#) P<0.05 control vs. BMP; (##) P<0.01 control vs. BMP; (###) P<0.001 control vs. BMP.

