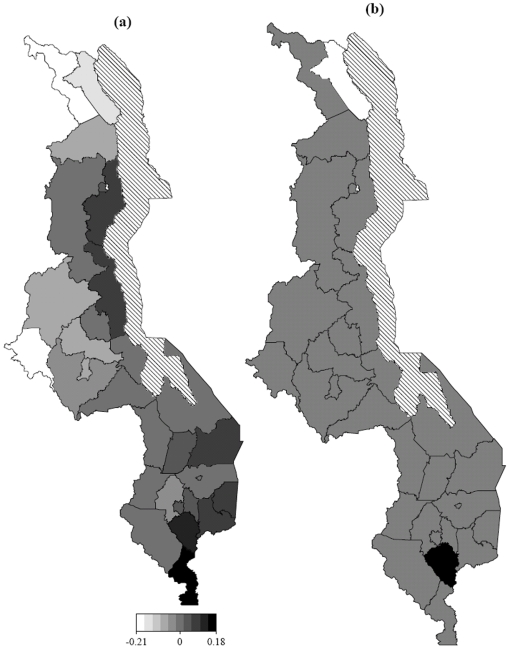
Figure 6. Structured spatial effects.
(a) Structured spatial effects, at subdistrict level, of neonatal death (Model M3). Shown are the posterior modes. (b): Corresponding posterior probabilities at 80% nominal level, white denotes regions with strictly negative credible intervals, black denotes regions with strictly positive credible intervals, and gray depicts regions of nonsignificant effects.

