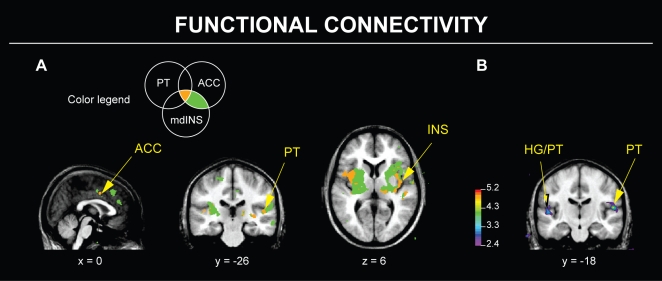
Figure 2. Functional connectivity during simple singing before and after training.
A: The different overlap patterns between three connectivity maps during simple singing, generated with seed voxels in right planum temporale (MNI/ICBM152 world coordinates 52, −20, 6), right mid-dorsal insula (40, 4, 6), and left ACC BA 24 (−2, 4, 44); all voxel ps≤0.001, uncorrected. The Venn diagram above depicts the color legend used to show overlap in connectivity maps. B: After training, the right planum had stronger connectivity with an adjacent region of right planum and the cortex of the left Heschl's sulcus, which contains Heschl's gyrus and/or planum, during simple singing. All peak/cluster ps≤0.05, corrected. ACC = anterior cingulate cortex; BA = Brodmann area; HG = Heschl's gyrus; INS = insula; mdINS = mid-dorsal insula; PT = planum temporale.

