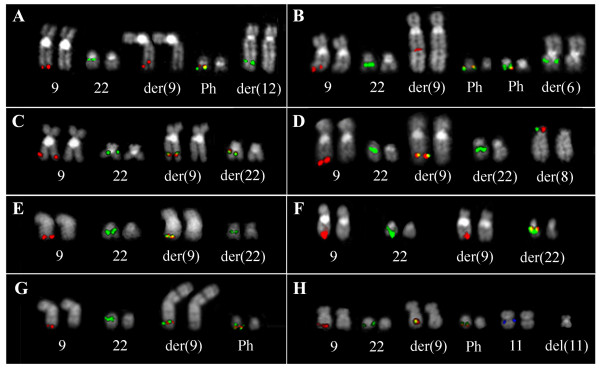
Figure 1.
FISH pattern observed with specific probes for the ABL1 and BCR genes on bone marrow metaphases from the analyzed CML patients. Examples from each of the identified cytogenetic groups are shown: "masked der(9)" (A, B), "masked Ph" (C, D), "cryptic insertions" (E, F), and "concomitant rearrangements" (G, H).

