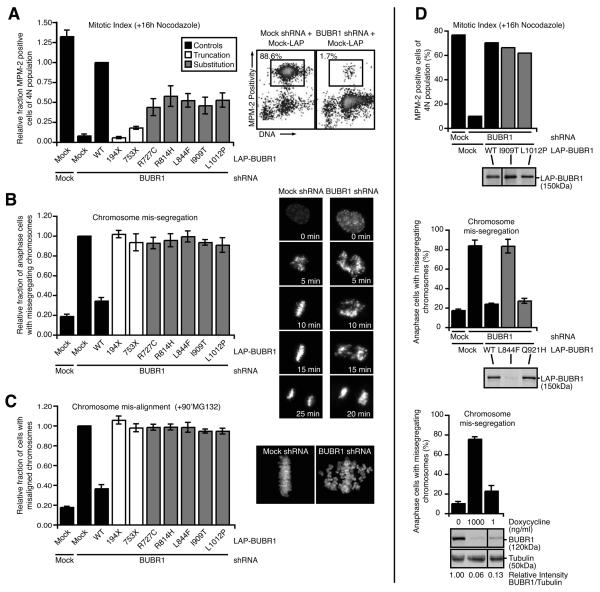
Fig. 4. Low BUBR1 levels is the primary cause of BUBR1 dysfunction by MVA Mutations in the kinase domain.
(A) Flow cytometric analysis of MPM-2 positivity of U2OS cells transfected with control (Mock) or BUBR1 shRNA in combination with control or RNAi insensitive LAP-BUBR1 cDNA, treated with nocodazole for 16 hours. Boxes indicate percentage of cells positive for MPM-2. Graph represents the fraction of MPM-2 positive cells of 4N population relative to the LAP-BUBR1 WT control (average of at least 3 experiments, ± s.e.m.). (B) Analysis of chromosome segregation by live imaging of U2OS expressing H2B-EYFP and transfected as in 4A. Graph indicates the fraction of cells with chromosome mis-segregations relative to BUBR1 depleted cells (average of 3 experiments, a total of at least 238 cells, ± s.e.m.). (C) HeLa cells, transfected as in 4A, were treated with MG132 for 90 minutes and analyzed for chromosome alignment. Graph indicates the fraction of cells with misaligned chromosomes relative to BUBR1 depleted cells (average of 3 experiments, at least 90 cells counted per experiment, ± s.e.m.). (D, upper) Flow cytometric analysis of MPM-2 positivity of U2OS cells transfected control (Mock) or BUBR1 shRNA in combination with control or RNAi insensitive LAP-BUBR1 cDNA, substitution mutants were overexpressed to levels comparable to wild-type, and treated with nocodazole for 16 hours. Graph represents the percentage of MPM-2 positive cells of 4N population. Immunoblot shows the expression of wild-type and mutant LAP-BUBR1 in lysates from the same experiment (1 representative experiment). (D, middle) Analysis of chromosome segregation by live imaging of U2OS expressing H2B-EYFP and transfected as in 4A. Graph indicates the percentage of cells with chromosome mis-segregations (average of 3 experiments, a total of at least 270 cells, ± s.e.m.). Immunoblot shows the expression of wild-type and mutant LAP-BUBR1 in lysates from a representative experiment. (D, lower) Analysis of chromosome segregation by live imaging of HeLa cells expressing inducible BUBR1 shRNA and H2B-EYFP treated with 0, 1 or 1000 ng/ml doxycycline. Graph indicates the percentage of cells with chromosome mis-segregations (average of 3 experiments, a total of at least 350 cells, ± s.e.m.). Quantitative immunoblot shows the expression of BUBR1 and Tubulin in lysates from a representative experiment, band intensity of BUBR1/Tubulin relative to untreated control is indicated (average of 3 experiments)

