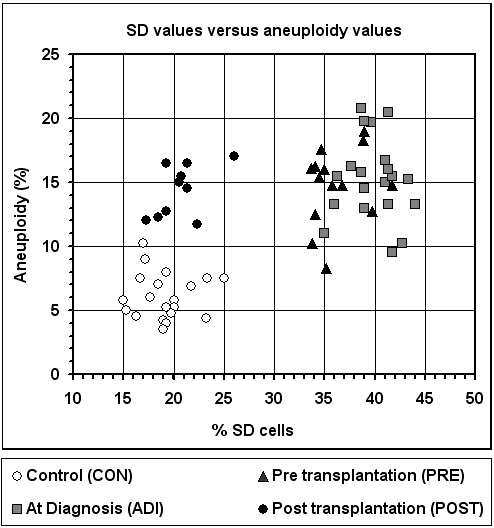
Figure 4.

Distribution of blood samples according to their SD cell frequency and aneuploidy level. The SD value of each sample is expressed by the mean of the SD cell frequency values of TP53, CEN17, and AML1; and the aneuploidy is the mean of the aneuploidy values of chromosomes 17 & 21.
